

 Back
Back


INVESTOR OVERVIEW
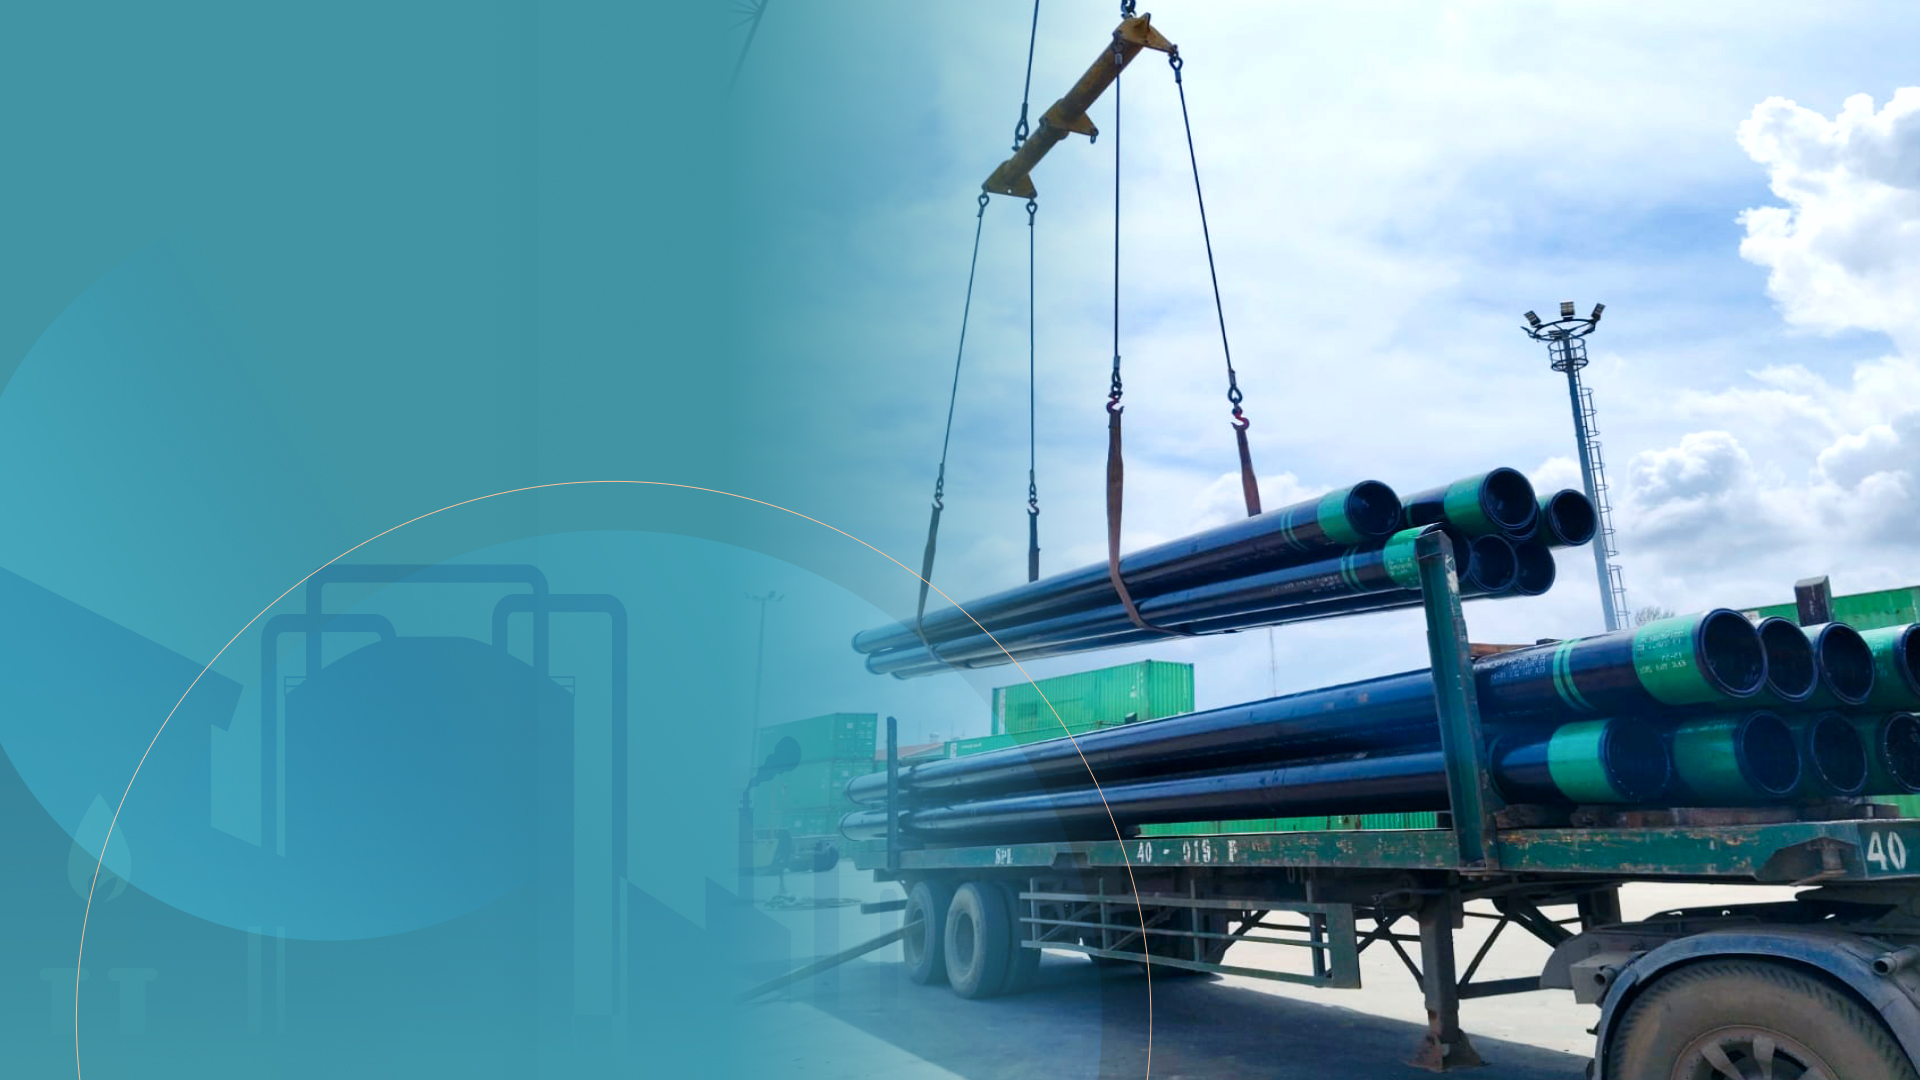
PT Sunindo Pratama Tbk (SUNI) was established in September 2002 as the player in the oil and gas supporting business and the pioneer in Indonesia for seamless Oil Country Tubular Goods (OCT) tubing as our biggest revenue contributor.
Our in-house OCTG tubing producers, PT Rainbow Tubulars Manufacture (RTM) enables us to secure the availability of the production throughout the year, making it as our vital strategic asset. RTM has also achieved the high local content (TKDN) and being supported by government TKDN regulation.
With the underserved market for tubing products in Indonesia coupled with the Government target in increasing oil and natural gas production by 2030, we have an enormous potential to boost our capacity and sustainable financial performance going forward.
INVEST WITH US
Why Invest With SUNI?
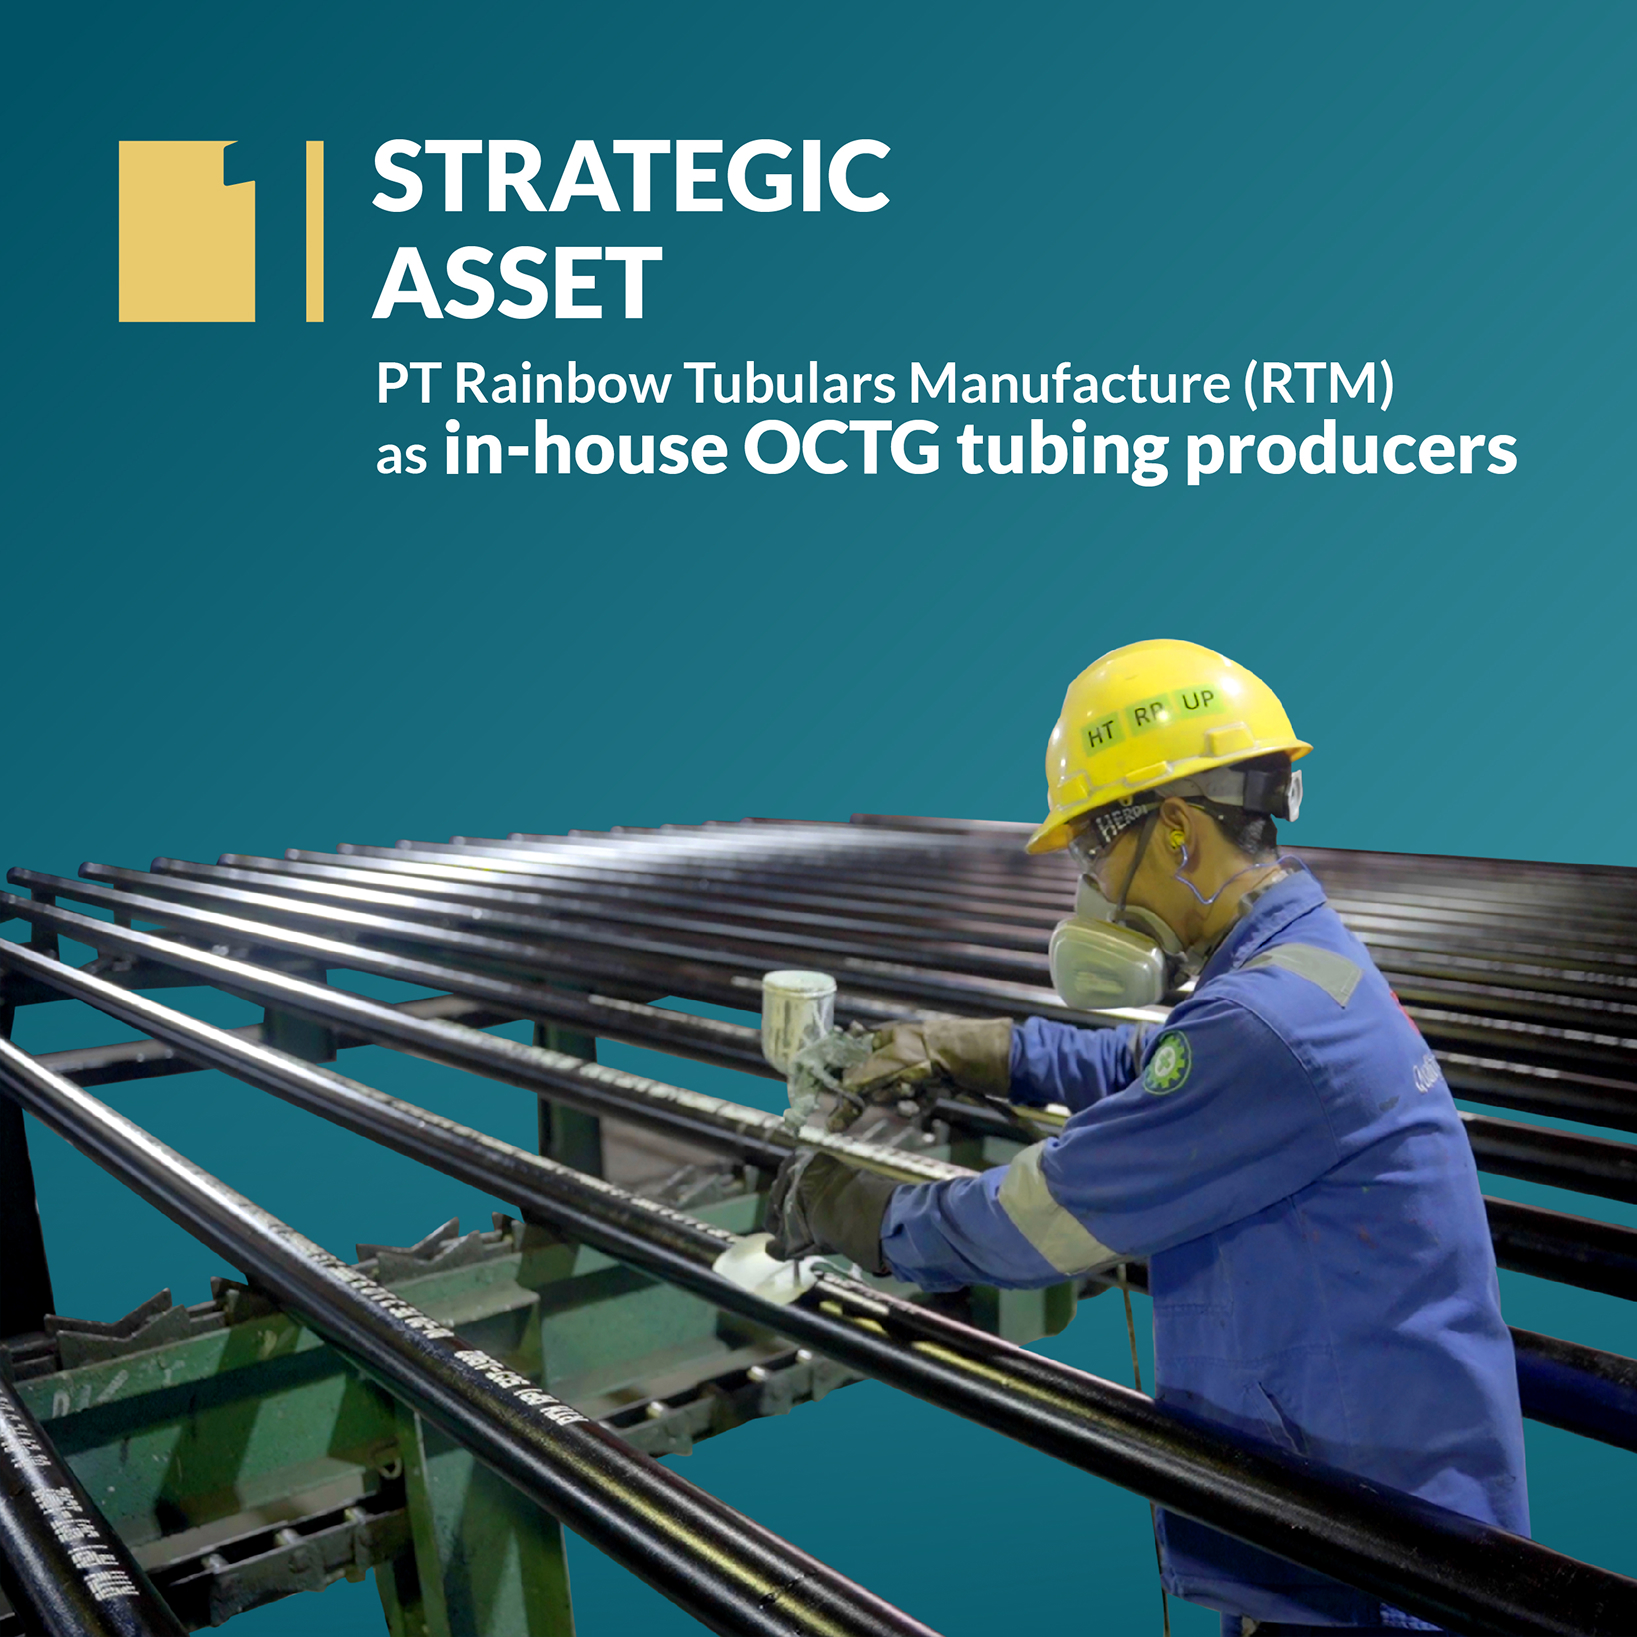
PT Rainbow Tubulars Manufacture (RTM) as in-house OCTG tubing producers

The only company in Indonesia, providing seamless/OCTG tubing
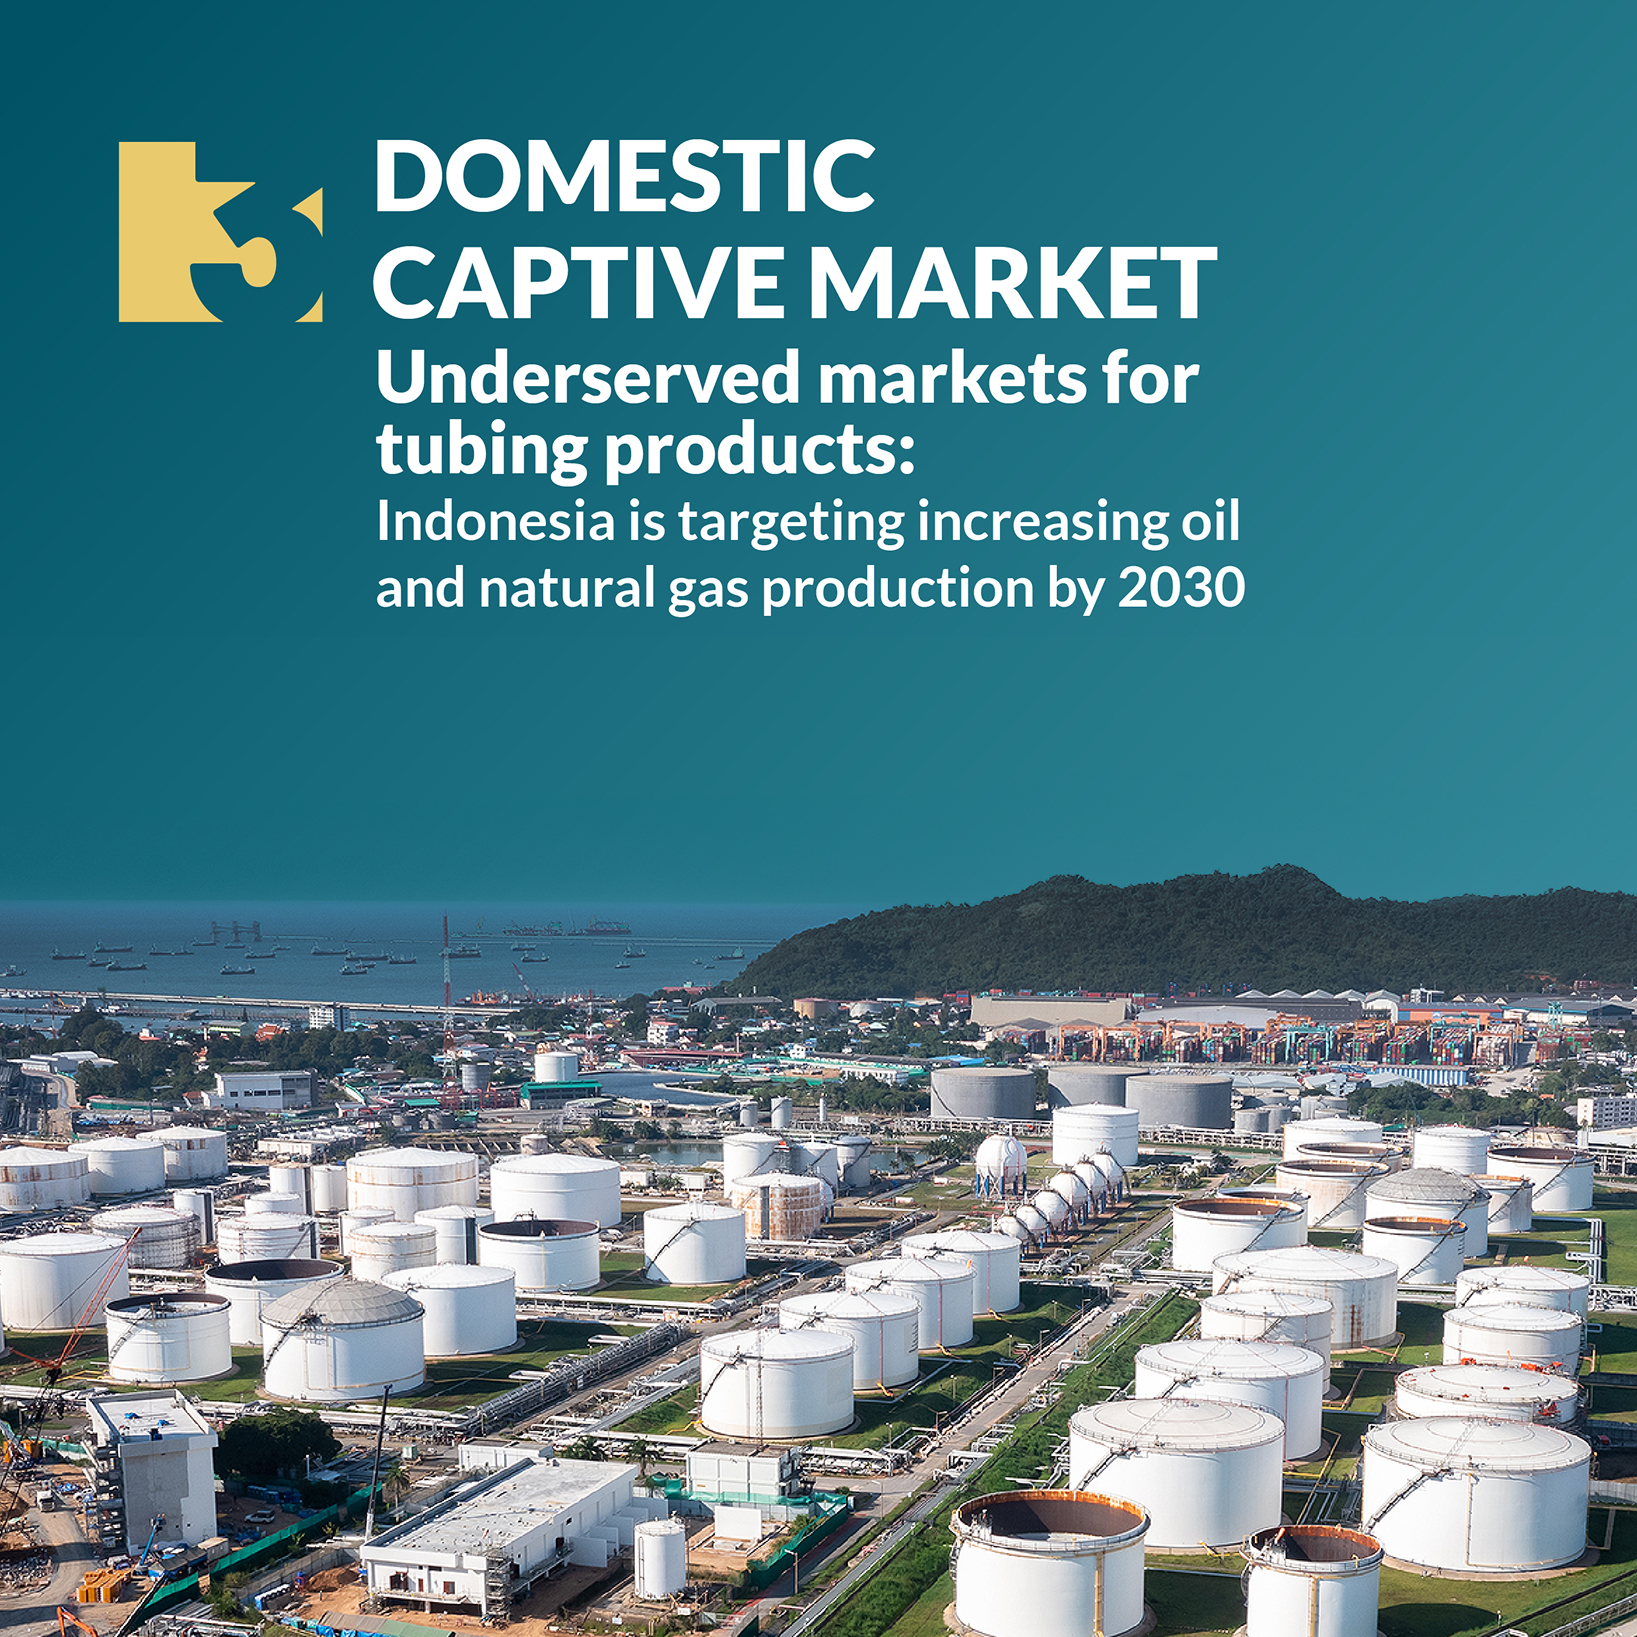
Underserved markets for tubing products: Indonesia targets to increase oil production to 1 million BOPD and gas to 12 MMSCFD by 2030
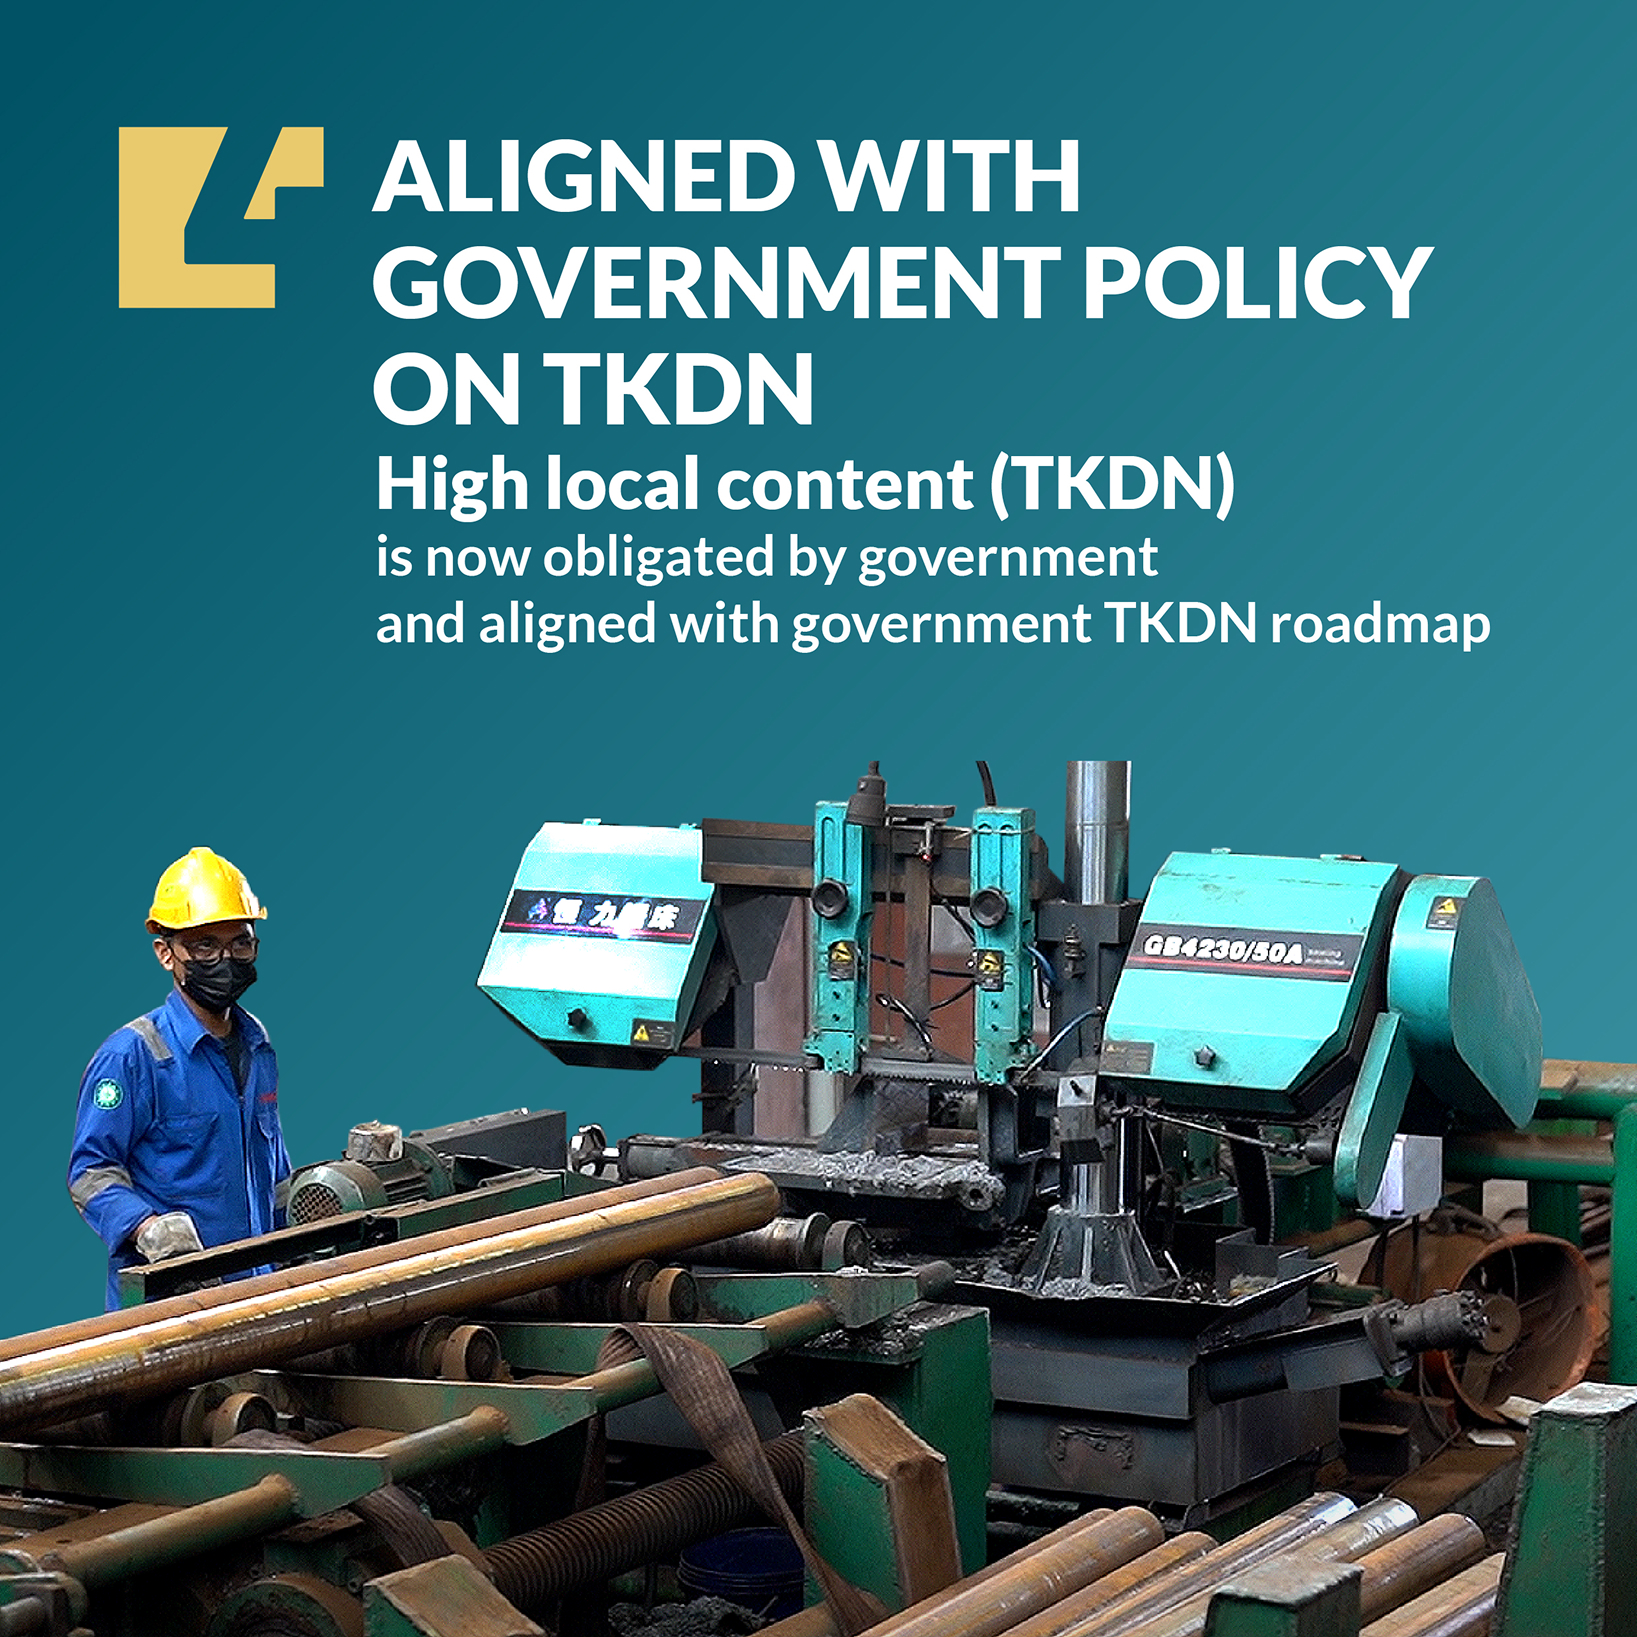
High local content (TKDN) is now obligated by government and aligned with government TKDN roadmap
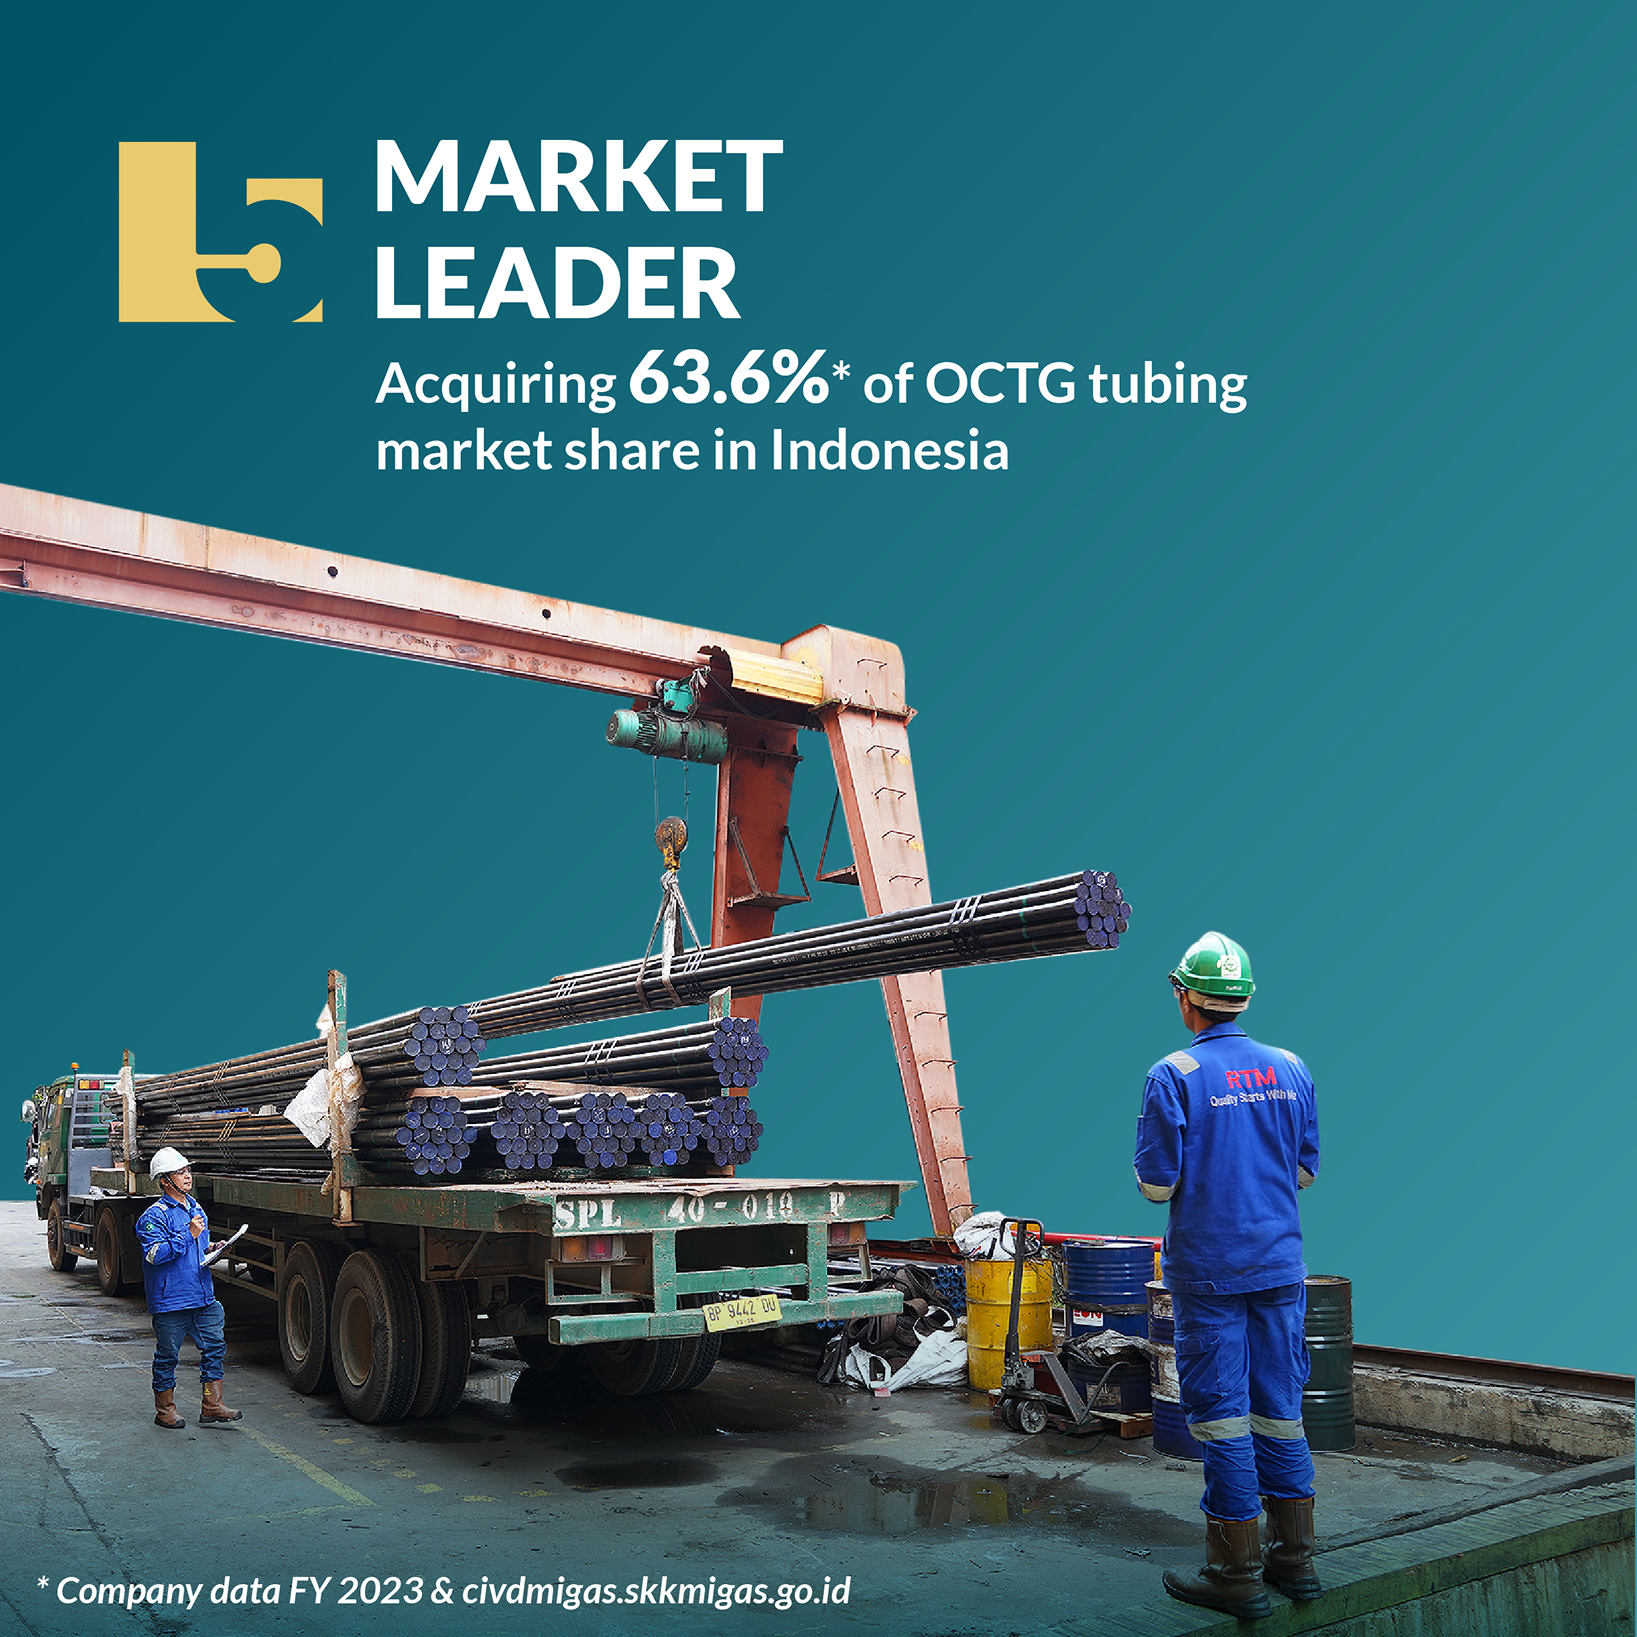
Acquiring the highest market share for OCTG tubing in Indonesia
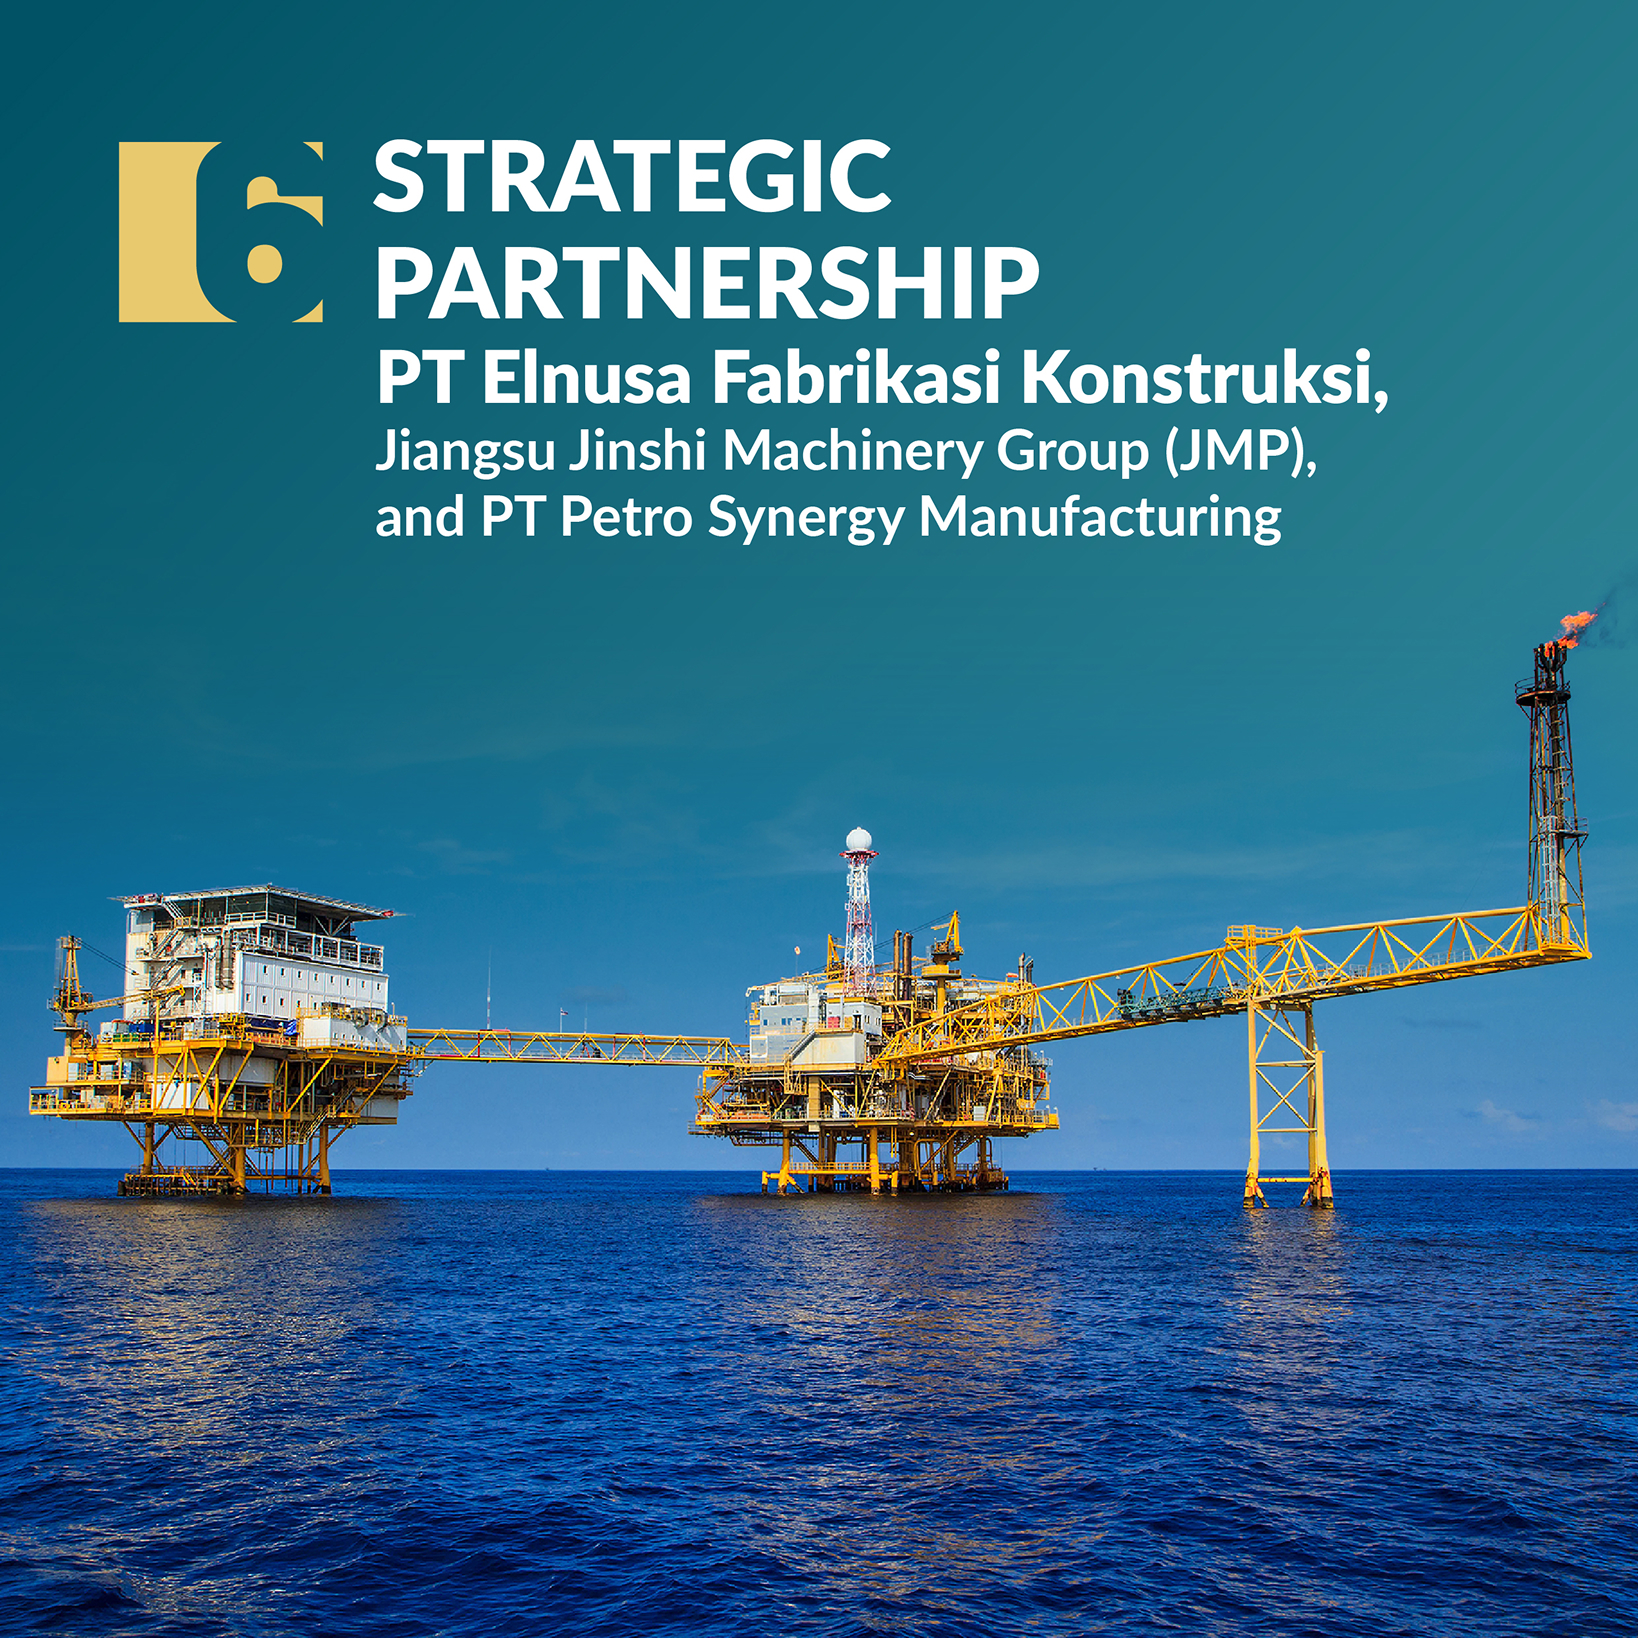
PT Elnusa Fabrikasi Konstruksi, Jiangsu Jinshi Machinery Group (JMP), and PT Petro Synergy Manufacturing
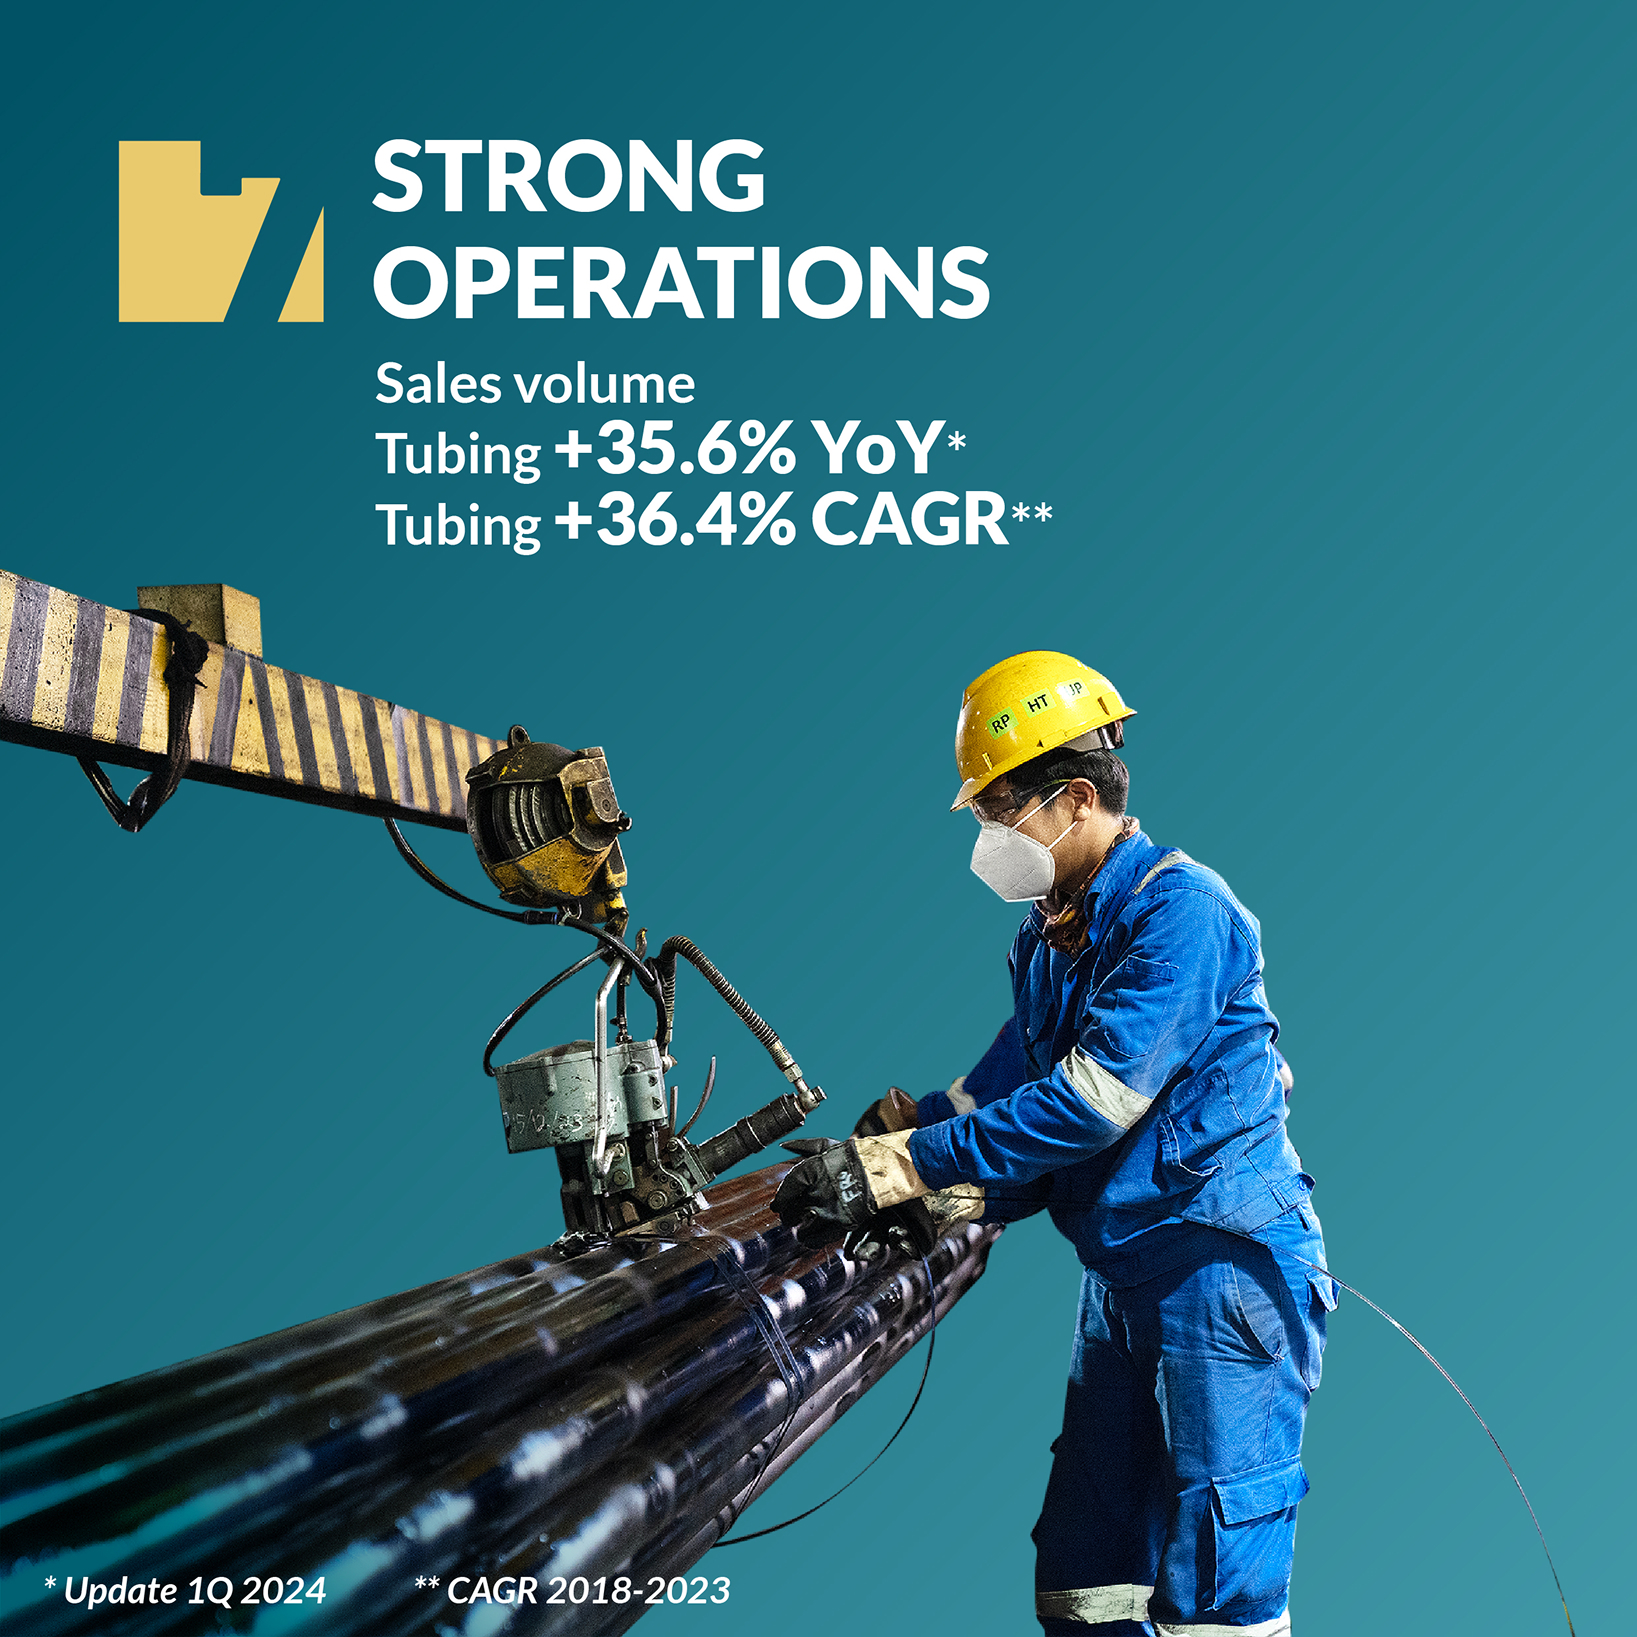
Sales volume
Tubing +35.6% YoY**
Tubing +36.4% CAGR***
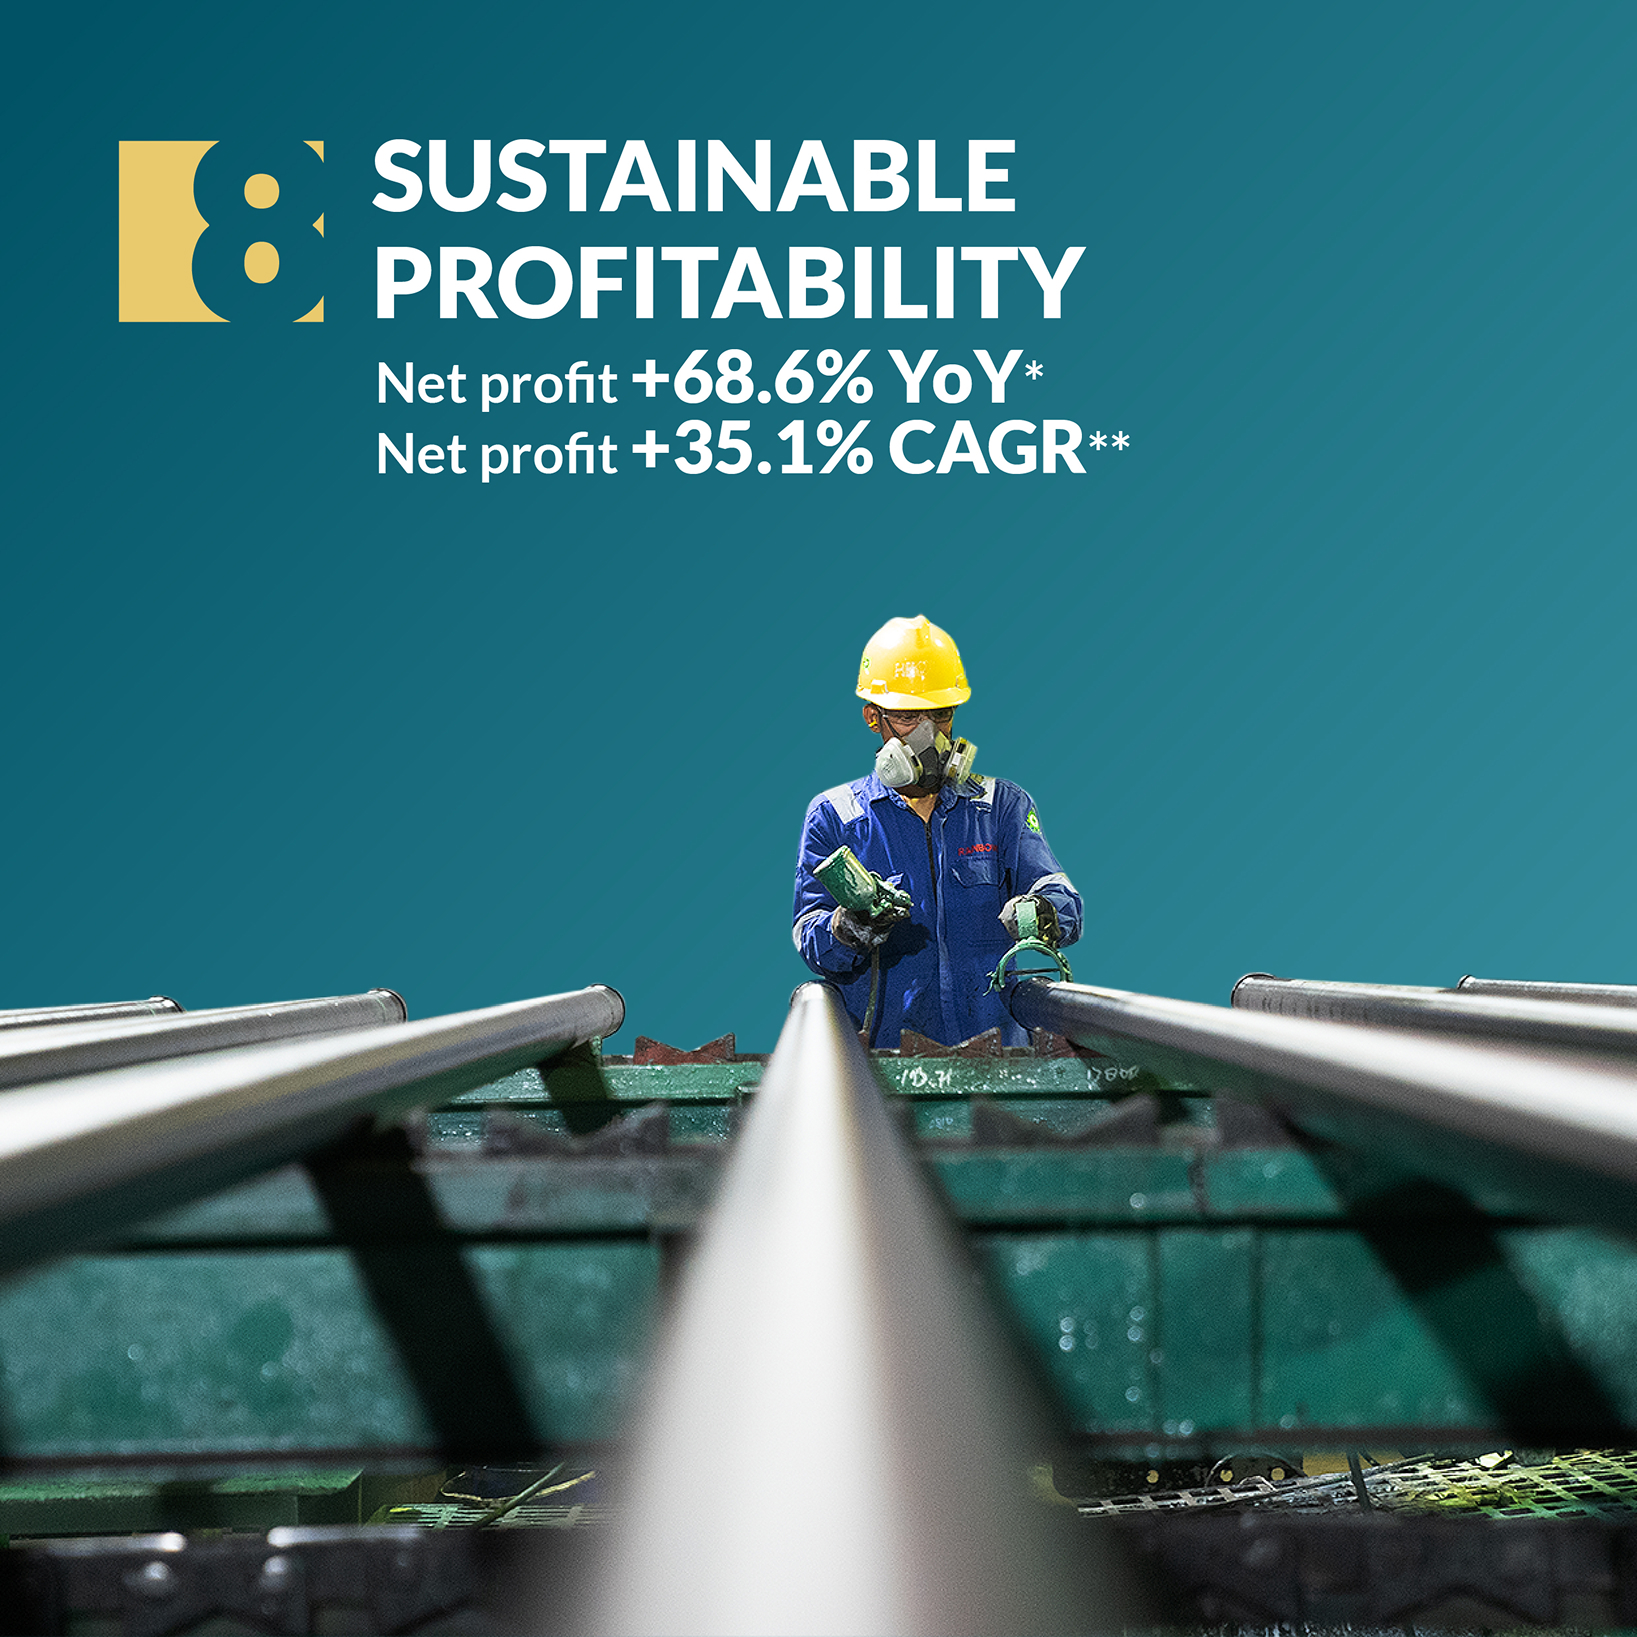
Net profit +68.6% YoY**
Net profit +35.1% CAGR***
DER 0.3 time**

Over 20 years of industry experience with a more than a decade of collective expertise among the Management

Zero fatality in operating activities

Registered Geothermal Service Company
FINANCIAL HIGHLIGHTS

Financial Highlights For Year Ended 2025

December 31, 2025
| As of and for the year ended December 31 | 2025 | 2024 | 2023 | 2022 | 2021 | Pada tanggal dan untuk tahun yang berakhir 31 Desember |
|---|---|---|---|---|---|---|
| STATEMENTS OF PROFIT OR LOSS | LAPORAN LABA RUGI | |||||
| Sales | 982.388.797.337 | 1.047.117.484.360 | 762.424.927.875 | 540.272.575.371 | 317.555.077.233 | Penjualan |
| Gross profit | 312.373.610.153 | 320.999.639.972 | 179.118.125.599 | 142.707.601.070 | 68.499.663.016 | Laba bruto |
| Profit for the year | 192.203.761.600 | 205.366.366.140 | 100.859.838.442 | 72.749.902.142 | 28.867.136.194 | Laba tahun berjalan |
| Total profit for the year attributable to: | Jumlah laba tahun berjalan yang dapat diatribusikan kepada: | |||||
| Owners of the parent entity | 193.580.630.211 | 207.021.987.709 | 101.204.103.274 | 62.808.146.032 | 23.333.639.985 | Pemilik entitas induk |
| Non-controlling interets | (1.376.868.611) | (1.655.621.569) | (344.264.832) | 9.941.756.110 | 5.533.496.209 | Kepentingan non-pengendali |
| Total comprehensive income for the year | 191.882.829.529 | 205.106.611.002 | 100.610.753.292 | 73.154.943.228 | 28.950.135.974 | Jumlah laba komprehensif tahun |
| Total comprehensive income for the year attributable to: | Jumlah laba komprehensif tahun berjalan yang dapat diatribusikan kepada: | |||||
| Owners of the parent entity | 193.259.105.590 | 206.760.946.705 | 100.955.019.982 | 63.209.332.416 | 23.449.581.344 | Pemilik entitas induk |
| Non-controlling interets | (1.376.276.061) | (1.654.335.703) | (344.266.690) | 9.945.610.812 | 5.500.554.630 | Kepentingan non-pengendali |
| Basic earning per share | 79,37 | 82,81 | 40,48 | 33,06 | 93,33 | Laba per saham dasar |
| STATEMENTS OF FINANCIAL POSITION | LAPORAN POSISI KEUANGAN | |||||
| Current assets | 491.993.327.359 | 632.751.422.851 | 537.129.075.317 | 390.115.438.219 | 288.138.855.169 | Aset lancar |
| Non-current assets | 626.386.719.018 | 439.679.445.532 | 251.775.685.556 | 141.638.343.017 | 149.310.262.851 | Aset tidak lancar |
| Total assets | 1.118.380.046.377 | 1.072.430.868.383 | 788.904.760.873 | 531.753.781.236 | 437.449.118.020 | Jumlah aset |
| Current liabilities | 99.812.632.654 | 198.891.452.225 | 136.284.364.292 | 141.798.364.717 | 119.115.127.663 | Liabilitas jangka pendek |
| Non-current liabilities | 155.436.665.459 | 91.078.918.774 | 64.327.660.199 | 9.157.436.827 | 10.690.953.893 | Liabilitas jangka panjang |
| Total liabilities | 255.249.298.113 | 289.970.370.999 | 200.612.024.491 | 150.955.801.544 | 129.806.081.556 | Jumlah liabilitas |
| Total equity | 863.130.748.264 | 782.460.497.384 | 588.292.736.382 | 380.797.979.692 | 307.643.036.464 | Jumlah ekuitas |
| FINANCIAL RATIOS | RASIO KEUANGAN | |||||
| Return on assets (%) | 17,19% | 19,15% | 12,78% | 13,68% | 6,60% | Rasio laba terhadap jumlah aset (%) |
| Return on equity (%) | 22,27% | 26,25% | 17,14% | 19,10% | 9,38% | Rasio laba terhadap ekuitas (%) |
| Gross profit margin (%) | 31,80% | 30,66% | 23,49% | 26,41% | 21,57% | Rasio laba kotor terhadap pendapatan (%) |
| Net profit margin (%) | 19,56% | 19,61% | 13,23% | 13,47% | 9,09% | Rasio laba bersih terhadap pendapatan (%) |
| Current ratio (x) | 4,93 | 3,18 | 3,94 | 2,75 | 2,42 | Rasio lancar (x) |
| Debt to equity (x) | 0,30 | 0,37 | 0,34 | 0,40 | 0,42 | Rasio liabilitas terhadap ekuitas (x) |
| Debt to assets (x) | 0,23 | 0,27 | 0,25 | 0,28 | 0,30 | Rasio liabilitas terhadap jumlah aset (x) |
FINANCIAL REPORT
Financial Report
| Date | Description | Download |
|---|---|---|
| Q2 - 2026 | For the 6 (Six) Months Period Ended June 30, 2026 |  |
| Q1 - 2026 | For the 3 (Three) Months Period Ended March 31, 2026 | |
| FY - 2025 | For the Year Ended December 31, 2025 | |
| Q3 - 2025 | For the 9 (Nine) Months Period Ended September 30, 2025 | |
| Q2 - 2025 | For the 6 (Six) Months Period Ended June 30, 2025 | |
| Q1 - 2025 | For the 3 (Three) Months Period Ended March 31, 2025 | |
| FY - 2024 | For the Year Ended December 31, 2024 | |
| Q3 - 2024 | For the 9 (Nine) Months Period Ended September 30, 2024 | |
| Q2 - 2024 | For the 6 (Six) Months Period Ended June 30, 2024 | |
| Q1 - 2024 | For the 3 (Three) Months Period Ended March 31, 2024 | |
| FY - 2023 | For the Year Ended December 31, 2023 | |
| Q3 - 2023 | For the 9 (Nine) Months Period Ended September 30, 2023 | |
| Q2 - 2023 | For the 6 (Six) Months Period Ended June 30, 2023 | |
| Q1 - 2023 | For the 3 (Three) Months Period Ended March 31, 2023 | |
| FY - 2022 | For the Year Ended December 31, 2022 | |